Learned Helplessness, Criminalization, and Victimization in Vulnerable Youth | By Elizabeth Trejos-Castillo, Evangeline Lopoo, and Anamika Dwivedi (December 2020) – Square One Project
— Read on squareonejustice.org/paper/learned-helplessness-criminalization-and-victimization-in-vulnerable-youth-by-elizabeth-trejos-castillo-evangeline-lopoo-and-anamika-dwivedi-december-2020/
Tag: Crime
A Tale of Two Countries: Racially Targeted Arrests in the Era of Marijuana Reform | American Civil Liberties Union
This ACLU research report, A Tale of Two Countries: Racially Targeted Arrests in the Era of Marijuana Reform, details marijuana arrests from 2010 to 2018 and examines racial disparities at the national, state, and county levels. Updating our previous report, The War on Marijuana in Black and White, that examined arrests from 2000 to 2010, this report reveals that the racist war on marijuana is far from over. More than six million arrests occurred between 2010 and 2018, and Black people are still more likely to be arrested for marijuana possession than white people in every state, including those that have legalized marijuana.
— Read on www.aclu.org/report/tale-two-countries-racially-targeted-arrests-era-marijuana-reform/
Impact Report: COVID-19 and Crime
Pandemic, Social Unrest, and Crime in U.S. Cities: November 2020 Update
This report updates previous research by the authors with additional crime data through the end of October 2020. It examines crime rates for ten offenses in 28 American cities during the COVID-19 pandemic and social unrest over police violence. Not all cities reported data for each offense, and offense classifications varied somewhat across the cities.
Under Fire
Shootings in Philadelphia. A Study from the Philadelphia Inquirer. In 8,500 shootings since 2015, suspects have been charged in 1 out of 5 cases and convicted in just 9%. See the report HERE
Pandemic, Social Unrest, and Crime in U.S. Cities: November 2020 Update
This report updates previous research by the authors with additional crime data through the end of October 2020. It examines crime rates for ten offenses in 28 American cities during the COVID-19 pandemic and social unrest over police violence. Not all cities reported data for each offense, and offense classifications varied somewhat across the cities.
See the report HERE
Violent Crime Rates Declined in 10 Jurisdictions Following Comprehensive Police Reform – Center for American Progress
Violent Crime Rates Declined in 10 Jurisdictions Following Comprehensive Police Reform – Center for American Progress
— Read on www.americanprogress.org/issues/criminal-justice/news/2020/11/16/492931/violent-crime-rates-declined-10-jurisdictions-following-comprehensive-police-reform/
What If Nothing Works? On Crime Licenses, Recidivism, and Quality of Life by Josh Bowers :: SSRN
We accept uncritically the “recidivist premium,” which is the notion that habitual offenders are particularly blameworthy and should be punished harshly. In th
— Read on papers.ssrn.com/sol3/papers.cfm
St. Louis homicide rate breaks record amid COVID-19 | ksdk.com
Fewer car stop and people stops could be the cause for the rise of crime and homicide. Interesting!!!
So far in 2020, there have been around 68 homicides for every 100,000 city residents.
— Read on http://www.ksdk.com/mobile/article/news/investigations/st-louis-homicide-rate-breaks-record-amid-covid19/63-60aa0060-e4bf-42a3-a0b0-4c46043b1d78
Is this the end of crime decline? – New York Daily News
Violence in New York is up. If you ask the NYPD, the 30-year New York City crime decline is over. Police have been known to cry wolf and can see the even most beautiful blue sky as falling. But what if this time it’s true?
— Read on www.nydailynews.com/opinion/ny-oped-the-end-of-crime-decline-20200719-e77s74cv7nhxjllosarp74lp2u-story.html
Mass Incarceration: The Whole Pie 2020
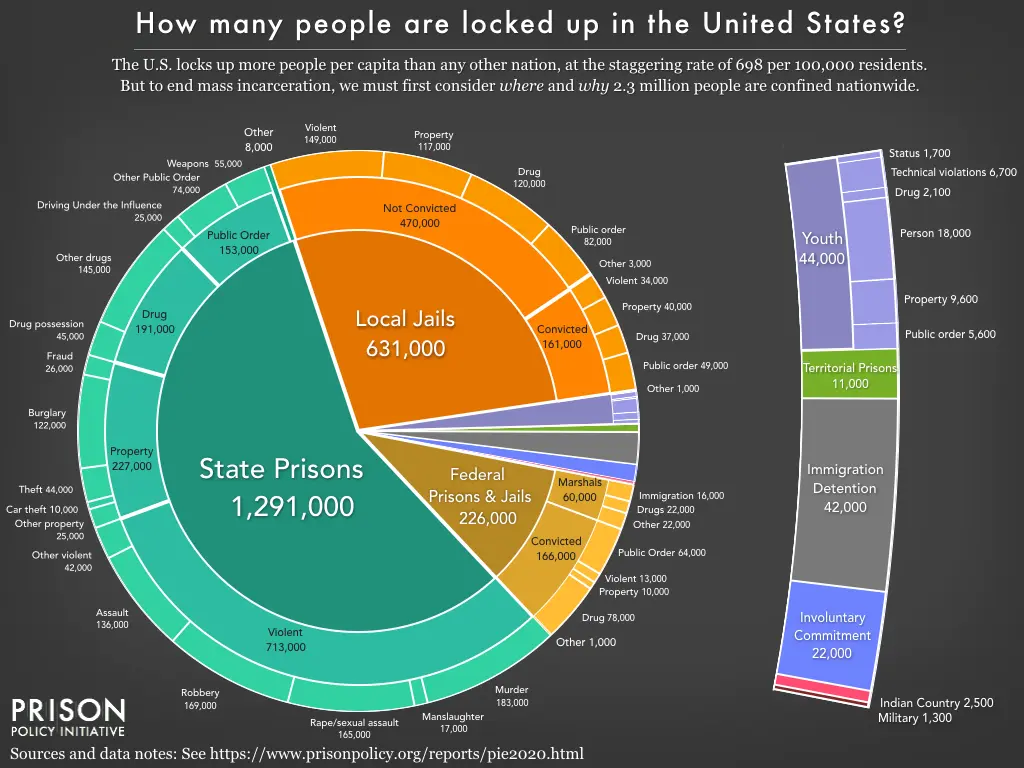
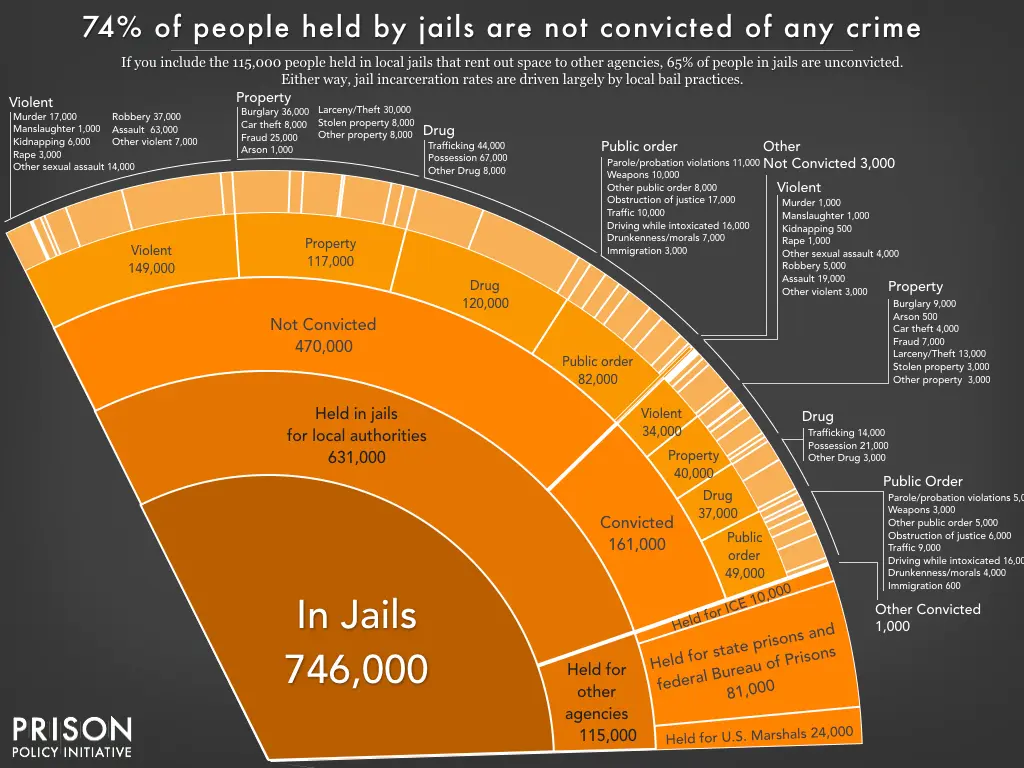
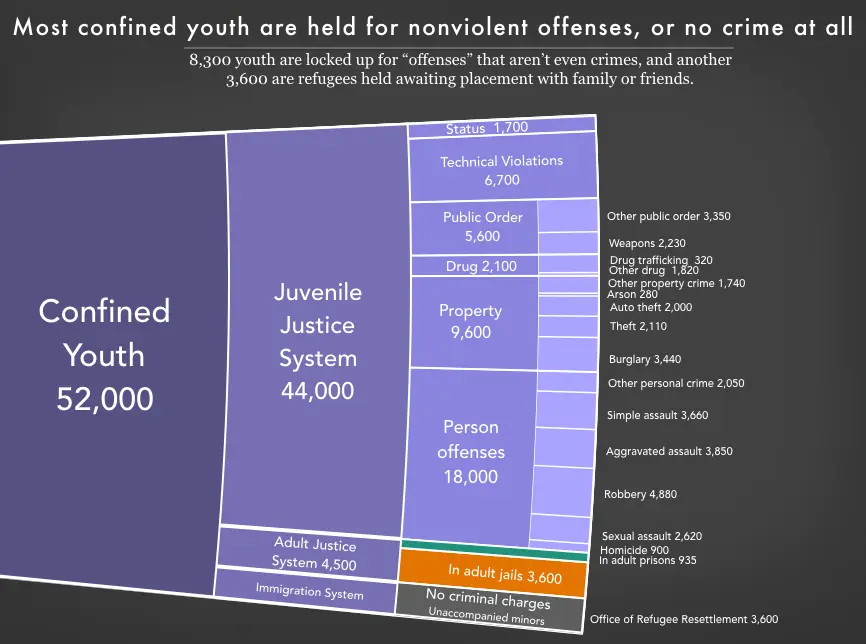
This report offers some much needed clarity by piecing together this country’s disparate systems of confinement. The American criminal justice system holds almost 2.3 million people in 1,833 state prisons, 110 federal prisons, 1,772 juvenile correctional facilities, 3,134 local jails, 218 immigration detention facilities, and 80 Indian Country jails as well as in military prisons, civil commitment centers, state psychiatric hospitals, and prisons in the U.S. territories.
This report provides a detailed look at where and why people are locked up in the U.S., and dispels some modern myths to focus attention on the real drivers of mass incarceration, including exceedingly punitive responses to even the most minor offenses.
Go to the webpage HERE